
For hotel owners and general managers, the business case for any technology investment has to be grounded in numbers, not promises. Digital signage is no exception.
This article compiles the most relevant research data available, from Cornell's Center for Hospitality Research, McKinsey, Deloitte and STR, and maps it to the specific value drivers that matter for hotel operations.
Labor and operational efficiency
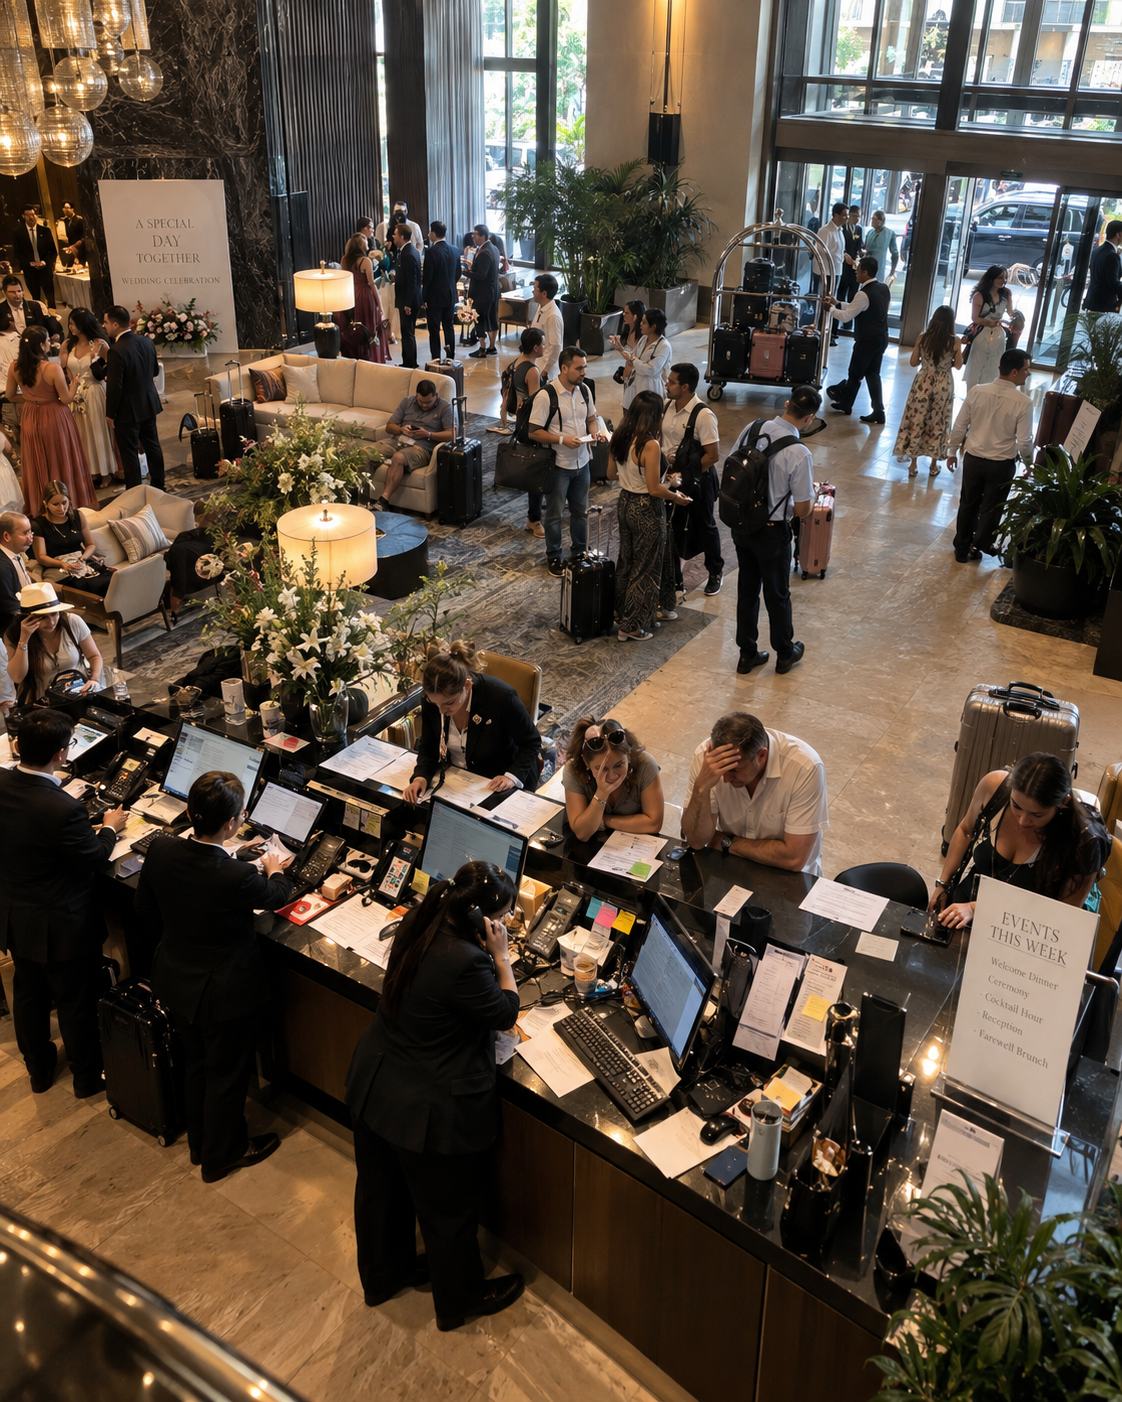
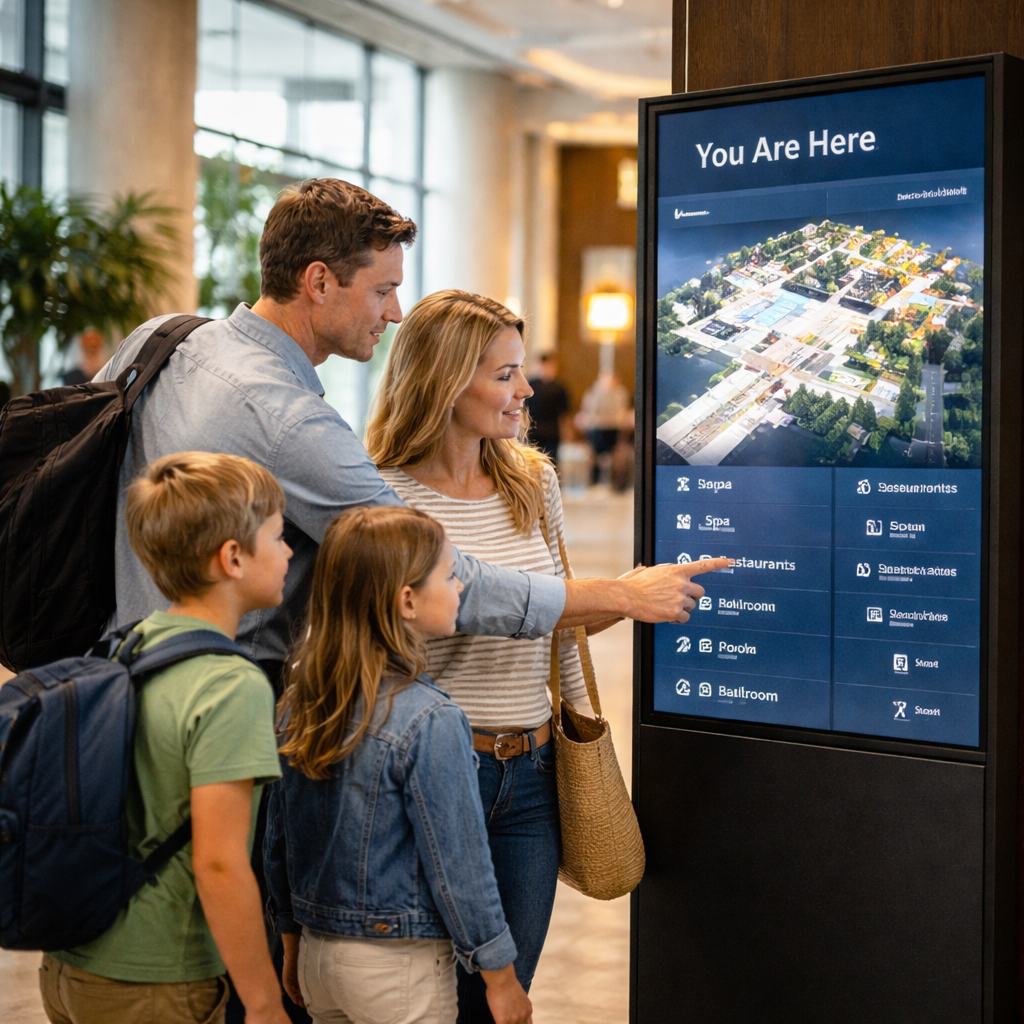
The most frequently cited ROI category for digital signage is the reduction in front desk labor load. In hotels without clear signage and wayfinding infrastructure, front desk staff absorb a significant volume of repetitive requests for directions, event information and basic amenity questions.
Research from Cornell's Center for Hospitality Research on tabletop digital interfaces documented a 36% reduction in front-of-house labor per check when guests used digital interfaces for payment, and a 65% reduction when digital interfaces handled both ordering and payment. When guests can get information from a screen, they don't need to get it from staff.
For centralized communication systems, McKinsey's research on Global Business Services models documented 20–30% cost reductions after implementing centralized communication infrastructure. Deloitte's Global Shared Services Survey found that 55% of organizations reported over 20% average cost savings after centralizing service delivery.
F&B and ancillary revenue
According to STR HOST data and AHLA analysis, ancillary revenue (F&B, spa and other operated departments) represents 30–36% of total revenue in U.S. upper upscale and luxury hotels. That share is disproportionately dependent on in-property communication.
Guests who see a promotion for a lunch special or a same-day spa opening are materially more likely to book than guests who don't see it. Screens placed in strategic locations (lobby, elevator banks, corridors near F&B and spa) convert passive traffic into active revenue.
Deloitte research shows that personalized in-property experiences drive 15% more revenue per guest, with 61% of guests willing to spend more at properties that provide relevant, personalized communication.
Guest message recall
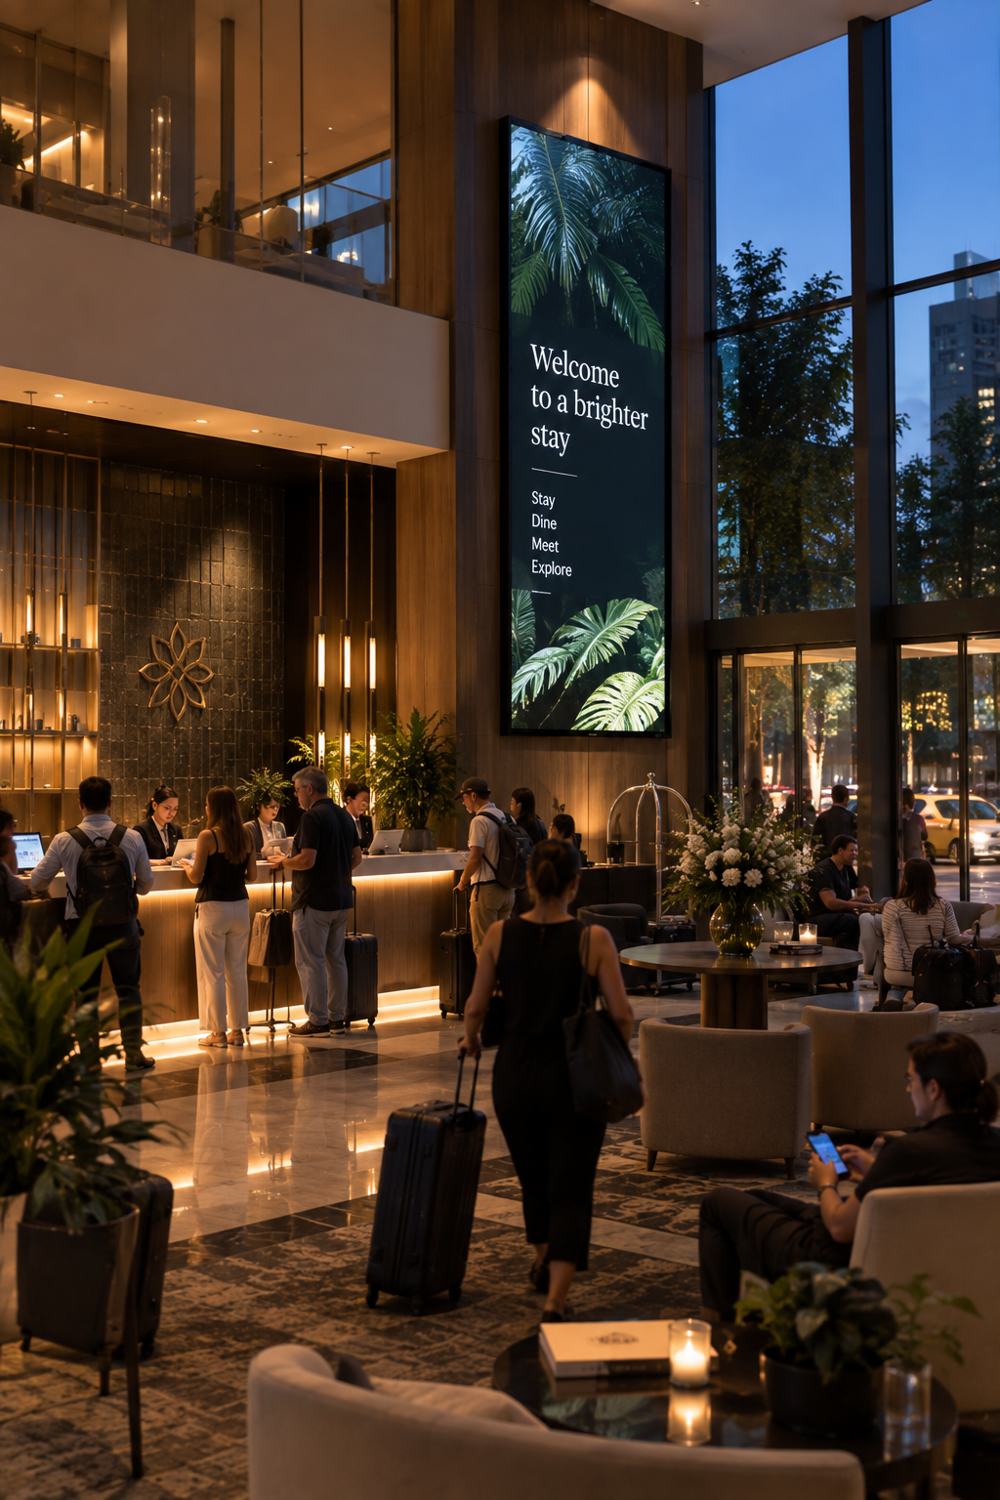
Research on digital messaging in hotel environments found that guests recall 65% of messages shown on screens, compared to just 23% for paper-based signage. This matters for both guest experience and revenue: guests who understand their options make more informed choices and report higher satisfaction with their stay.
The implication is direct. Every service, promotion or event that goes uncommunicated is a missed revenue and satisfaction opportunity. Digital screens ensure that communication actually reaches guests.
Printing cost reduction
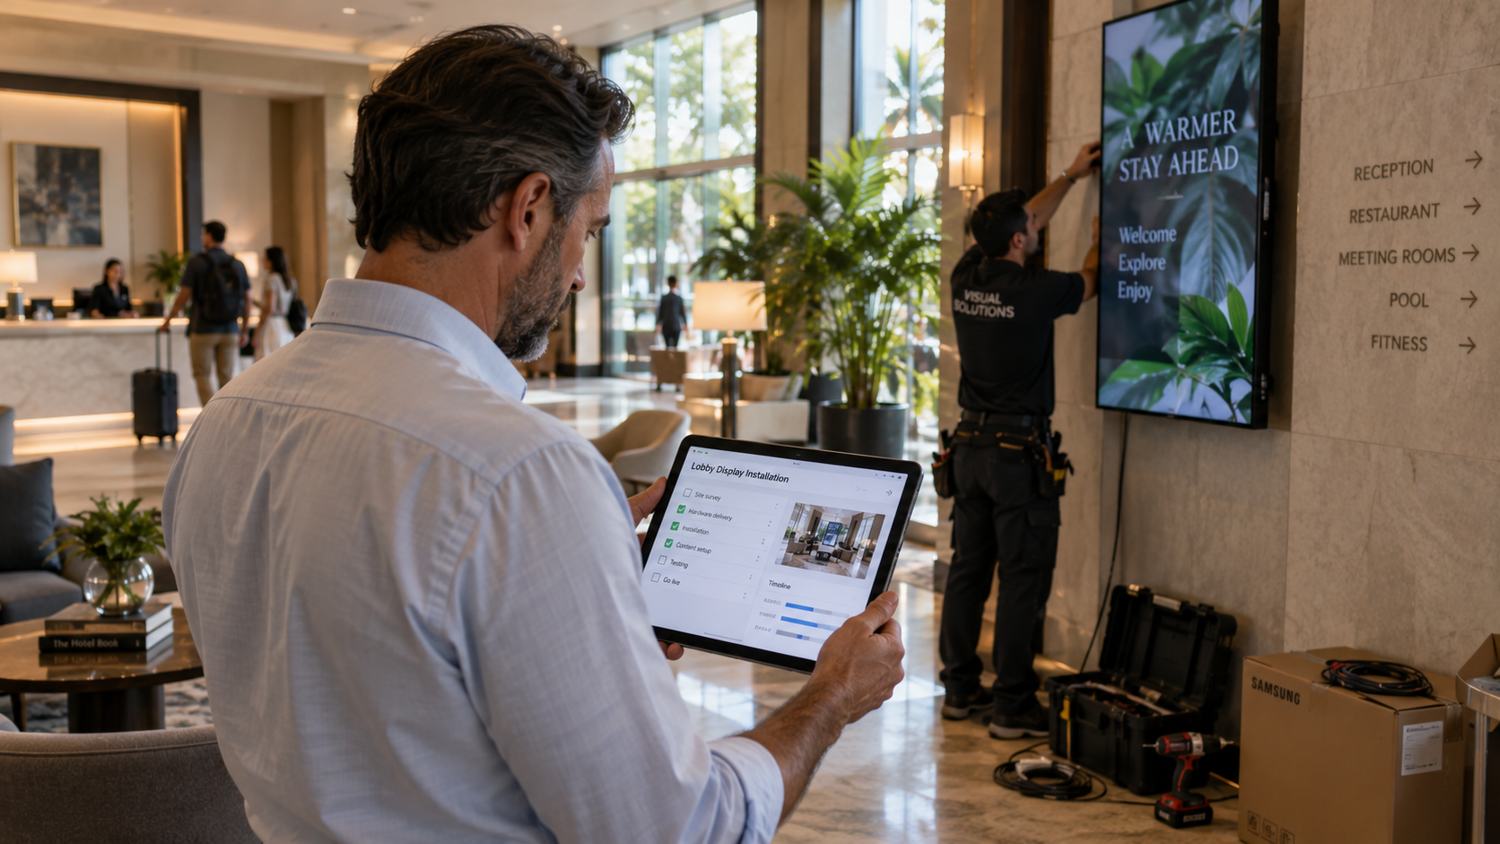
Properties that replace printed event signage, daily programs, directional signage and promotional materials with digital systems typically document 50–70% reductions in print spend. For a full-service hotel running regular print updates for events, menus and property communications, this is a tangible and immediately measurable line item.
Logical Signage client data shows 70% reductions in printing costs across deployed properties. For a hotel spending $3,000/month on printed signage, that represents over $25,000 in annual savings.
Key data: full summary
| KPI | Data point | Source |
|---|---|---|
| Guest message recall | 65% digital vs 23% print | Digital Signage Today |
| Labor reduction (payment) | 36% reduction per check | Cornell CHR |
| Labor reduction (order + payment) | 65% reduction per check | Cornell CHR |
| Ancillary revenue share | 30–36% of total hotel revenue | STR / AHLA |
| Cost reduction: centralized comms | 20–30% operational cost reduction | McKinsey GBS |
| Cost savings: shared services | 55% reported >20% savings | Deloitte Survey |
| Revenue from personalization | +15% revenue per guest | Deloitte |
| Printing cost reduction | 50–70% reduction | Logical Signage clients |
Building the internal business case
For hotel asset managers and ownership groups, the ROI model for digital signage typically includes three components:
- Operational cost reduction: labor reallocation, printing elimination, manual update processes
- Ancillary revenue uplift: F&B, spa, promotions, upsell visibility across the property
- Guest satisfaction impact: reflected in review scores, NPS and repeat stay rates
The most useful first step is an internal audit. How much is the property currently spending on printed signage per year? What percentage of front desk interactions are directional or informational? What is average ancillary revenue per guest compared to comp set benchmarks? These numbers establish the baseline against which a digital signage investment can be measured.